Seeing the Market Beyond the Surface
There’s a moment every market participant experiences. You look at a chart, and something feels familiar, almost predictable, yet not entirely clear. The price drops sharply, pauses, and then… What comes next?
I’ve seen this pattern repeat across different markets and timeframes. At first, it felt like noise. But over time, you start noticing structure within that movement. That structure often leads back to one formation: the bear flag pattern.
What makes it interesting isn’t just the shape itself, but where it appears in the broader market cycle. It doesn’t show up randomly. It tends to emerge at specific moments when momentum pauses before continuing in the same direction.
Understanding that timing changes everything. It shifts your perspective from reacting to price to interpreting behavior.
Understanding Market Cycles Before Patterns
The Phases That Shape Price Movement
Before focusing on any pattern, it helps to understand how markets move in cycles. Price action typically flows through phases of accumulation, expansion, distribution, and decline. These phases reflect shifts in sentiment, liquidity, and participation.
In a downtrend, the decline phase doesn’t move in a straight line. It unfolds in waves, often interrupted by temporary pauses. These pauses are not random—they reflect a moment where selling pressure stabilizes before continuing.
Why Patterns Depend on Context
A pattern without context can be misleading. The same structure can mean different things depending on where it appears in the cycle.
The bear flag pattern gains significance when it forms during a clear downtrend. In this context, it often represents continuation rather than reversal. Recognizing this relationship between pattern and cycle allows for more accurate interpretation of price behavior.
What Is a Bear Flag Pattern in a Downtrend?
Breaking Down the Structure
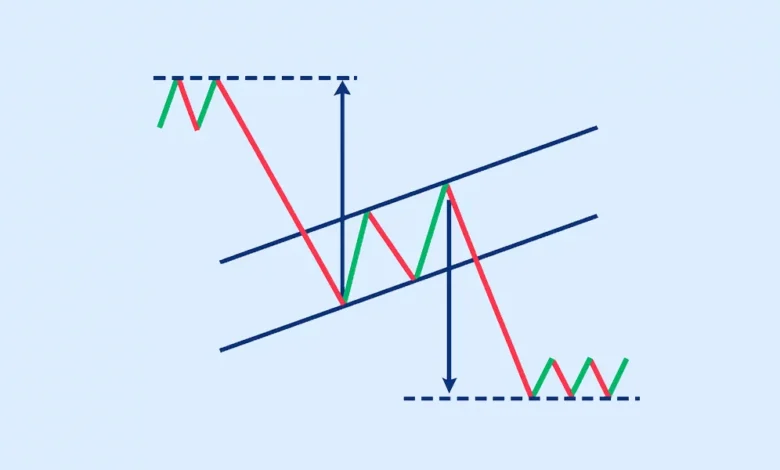
The bear flag pattern forms after a strong downward move, often called the “flagpole.” This sharp decline is followed by a period of consolidation where price moves slightly upward or sideways within a narrow range.
This consolidation phase creates the “flag.” It reflects a temporary pause where the market absorbs the previous move. However, the underlying pressure often remains bearish.
Why It Signals Continuation
The key to understanding this pattern lies in momentum. The initial drop shows strong selling activity. The consolidation that follows does not reverse that pressure; instead, it delays it.
When price breaks below the consolidation range, it often continues downward, aligning with the broader trend. This is why the pattern fits naturally within the decline phase of market cycles.
The Role of Momentum and Psychology
What the Pattern Reveals About Behavior
Markets are driven by decisions, and decisions are influenced by psychology. After a sharp decline, some participants exit positions, while others hesitate, waiting for confirmation.
This hesitation creates the consolidation phase. It’s a moment of uncertainty where the market appears calm, but underlying pressure still exists.
How Momentum Builds Again
Once the pause ends, momentum often returns quickly. The continuation reflects renewed confidence in the prevailing direction.
This behavioral dynamic explains why the bear flag pattern appears repeatedly across different markets and timeframes. It represents a natural rhythm in price movement rather than an isolated event.
Connecting Bear Flag Patterns With Broader Analysis
Combining Patterns With Market Frameworks
Patterns become more powerful when combined with broader analytical frameworks. For example, when viewed alongside wave-based structures, the bear flag pattern often aligns with corrective phases within a larger impulse move.
This is where concepts taught in an Elliott Wave course can add depth. They provide a structured way to interpret how continuation patterns fit into larger price movements.
Adding Context Through Market Environments
Different platforms and environments also influence how patterns behave. Observing price action across various conditions, including platforms like Alchemy Markets, helps build a more comprehensive understanding of how these formations develop in real-time.
This layered approach allows for more informed decisions rather than relying on patterns alone.
Common Misinterpretations and How to Avoid Them
Mistaking Consolidation for Reversal
One of the most common mistakes is assuming that a pause in price movement signals a reversal. In reality, consolidation often represents continuation, especially within a strong trend.
Ignoring the Bigger Picture
Another issue is focusing too narrowly on the pattern itself. Without considering the overall market cycle, it becomes difficult to interpret its meaning accurately.
The Importance of Patience
Timing plays a crucial role. Entering too early during consolidation can lead to confusion, while waiting for confirmation provides clearer signals.
Avoiding these misinterpretations requires discipline and a broader perspective.
Seeing Patterns as Part of a Larger Story
The bear flag pattern is more than a visual formation on a chart. It’s a reflection of how markets move through cycles, pause, and continue.
When you understand where it fits within a downtrend, it becomes easier to interpret its significance. Instead of reacting to isolated movements, you begin to see the bigger picture.
This shift in perspective transforms how you approach price action. It turns patterns into context, and context into insight.
Over time, this understanding builds consistency. And in markets, consistency is what makes the difference.